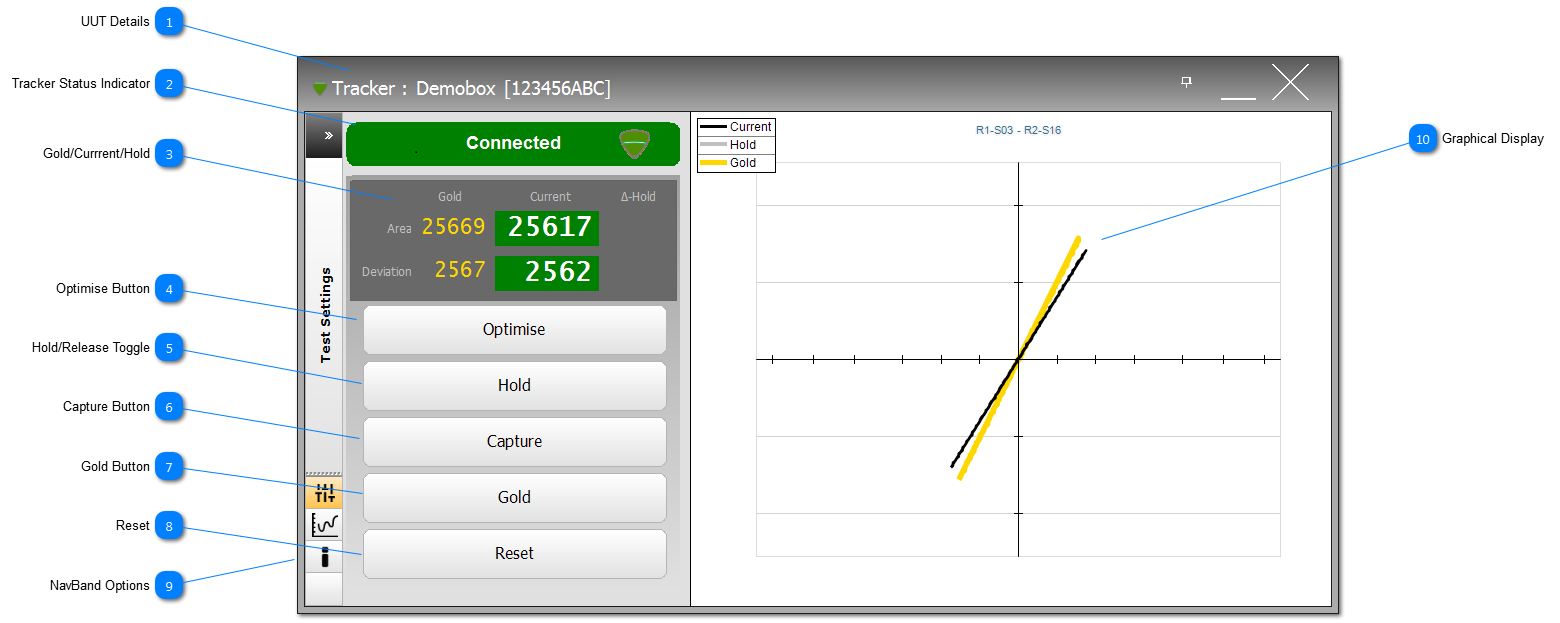
The Tracker can be used as a stand-alone application, with the settings being supplied by the Tracker.ini file. If the Tracker is being used as part of the NODES™ software, then it is setup and controlled by NODES™. Status of the Tracker is shown by the status bar which is currently showing that the Tracker is connected and the small icon shows that the application is active.
Other states include: Initialising..., Not Connected and Simulated.
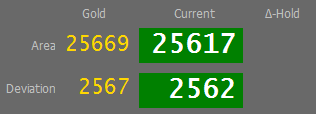
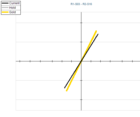
The Area and Deviation values are calculated by the Tracker's bespoke algorithm that uses the shape of the signature captured, as shown on the graph and its reference to the axis.
The Gold values are shown in yellow; if there is no Gold then '-----' will be displayed.
The current reading is shown in white on a green background (status is deemed good) or a red background (status has failed).
A failed status will only be shown if there is a Gold, and if the current reading is out of tolerance when its signature is compared to the Gold signature.
The ∆-Hold is the absolute difference of the current readings to the current reading when the Hold button was activated.
Click to allow an in-built algorithms to optimise the settings for the component/circuit under test, see Tracker NavBands for more details on available settings.
Shown in the Hold state, this button allows the Tracker to Hold a reading, shown in Grey on the graph. Press the Release button, to clear the hold values and resume constant readings.
This function can be used to Hold current reading and then probe the circuit to see if changes occur; a excellent diagnosis tool for finding loss components, dry joints etc.
Click Gold to declare the currently readings as the Gold.
If there is no Gold, then the button will show Profile. Use the Profile button to create a new Test Profile using the current test settings, the TPs connected and the current values as the new Gold.
Clear Hold information; the current readings will still continue to show for each reading taken, and if there is a Gold, the current reading's background will reset to green until a fail condition occurs.
The Tracker application has a number of NavBands available to the User (the current view shows the About NavBand selected). See Tracker NavBandsfor more details.