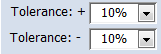
Set the upper and lower tolerance bands for the test points being tested. Tolerances can be set as either percentage values of the Datum value or as ohmic values. If the Gold value is used, then the test point tolerances are applied as set in the Test Point Add/Edit form.
The set tolerances are applied to the Datum value and displayed as Min Limit and Max Limit in the grey area below the graph. Changing either of these values will cause the LogScope to halt and require the User to press either the Reset LogScope or Continue Reading button; this gives the User the opportunity to Copy or PDF the current graph before resetting the LogScope with the new settings.
This text displays if the IFD™ hardware is connected to the selected TPs. The shown text indicates that the IFD™ is connected, if it is not the text turns red and reads: 'Selected Test Points are NOT Connected to theIFD™'. IFD™ or the DMM is being simulated, then the text turns amber and reads: 'IFD™ and/or DMM Simulated as Connected'.
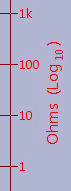
All the readings are displayed in Log10 in Ohms. The black trace is the actual reading taken. The red trace is the absolute difference between the previous and current reading (ie if the difference was 0.235 or -0.235 they would be both plotted as 0.235). The red trace only starts to display a trace once the absolute difference is greater than 0.01 Ohm and any reading greater than 100k Ohms is capped at the top of the graph.
The x-axis is equal to 1 pixel per reading and so at a setting of 3 readings/sec, 3 pixels is equivalent to 1 second. A small black marker shows the position of the readings scale as the test progresses; this is extremely helpful if the component/test point is very stable and the red trace is hugging the bottom of the x-axis.
In the centre of the Drift Meter, the Datum reading is displayed in black and the current reading is displayed in blue, if within limits, and in red, if over limits.
At either end of the Drift Bar a number of different readings and limits are displayed during the Log Scope test.
At the left-hand side:
Min Limit - calculated using the Datum value and the Tolerance - setting.
Min Value - captured as the Min Value is breached by the current reading; this value is black if it is within limits and red if lower than the Min Limit.
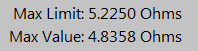
At the right-hand side (shown above):
Max Limit - calculated using the Datum value and the Tolerance + setting.
Max Value - captured as the Max Value is breached by the current reading; this value is black if it is within limits and red if higher than the Max Limit.
If either of the limits are breached then a symbol will be displayed at the appropriate end of the Drift Bar.
The Drift Bar is an extremely useful display that allows the User to visually identify the extent of the instability of the component/test point being tested. The length of the blue area is proportioned according to the Min & Max limits, and then the current reading is scaled to this length and then plotted as a red vertical line. The red line is left to accumulate as the readings progress so the extent of the drift can be clearly identified. A small red marker is displayed above the Drift Bar so that the current reading can be easily identified.
Click this button to freeze the DMM and the LogScope readings. Once pressed, this button will display Continue Reading in green. When the plot reaches the end of the chart, then depending on the Log Scope options selected under Test Options, the plotting will halt and this button will show Reading Halted in red.
Click to reset the LogScope test. This action will completely reset the whole test, and all graphical displays and readings will be lost; users might want to consider using the PDF or Copy buttons to capture the LogScope output before using this reset facility.
The User can select this button to capture the results of the Log Scope at the time of button press. The capture of results data will be accompanied by a snapshot of the chart. This action also carries out the follow-on function of creating a PDF as if the PDF button had been pressed.
Captured results can be reviewed in the Results Review form.
Copy the display of the Log Scope graph to the clipboard. This can then be pasted into programs such as Paint or report writing documents such as Word.