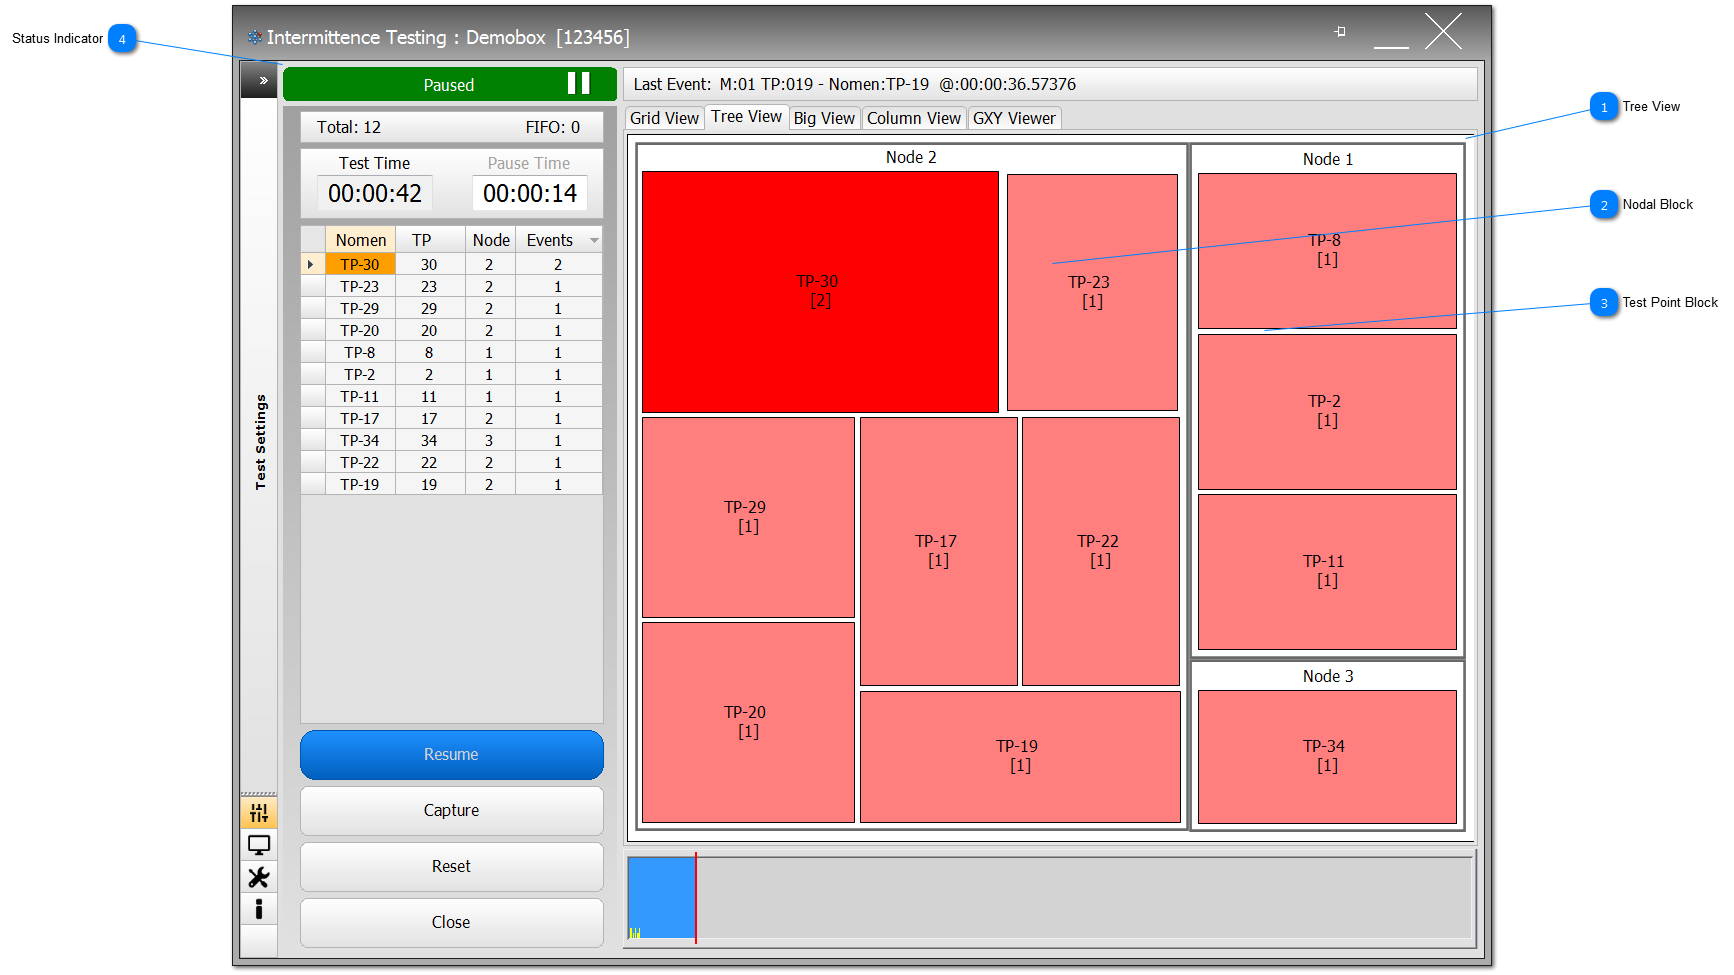
Each Node is represented by a Nodal Block. All associated test points for that Node are drawn within the Nodal Block. The Nodal Block will be proportional in size to the other Nodal Blocks based on the events within that Node vs other Nodes with Events. From the example shown, Node 1 is 1/3 the size of Node 2.
To show just a single Nodal Block, double-click on any part of the Nodal Block.
The more Events a TP has the darker the red block becomes. The nomenclature for the each block is the Nomen of the Test Point TP-2 followed in square brackets [1] by the number of Events.
If a TP has reached its Glitch Limit, it will show [Suspended]. If a TP has events beyond its Glitch Limit, it will show [20 (GLimit:2)].
If a TP is reset, then Test Point Block will reduce to very small rectangle and turn green.
The Status Indicator is a live watchdog, which is constantly monitoring the hardware and ensuring the Neural Network is active. If it shows green and Active, or momentarily red and Event, or shown here Paused, then the User can have confidence that the Intermittent Fault Detection is still running.