This report is designed to detail the test point details for a UUT and is mainly used as a quick reference guide for the UUT.
 It is advised that this report is not used for building the ITA, because it become quite confusing when reading the pin details vs the test point details.
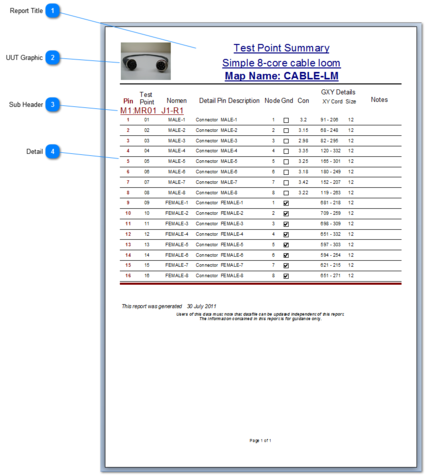
 Report Title Basic report title for the report including the UUT description and the Map Name.
|
 UUT Graphic If a UUT graphic has been allocated, then it will be displayed in the top left of the report, otherwise the Company logo will be displayed.
|
 Sub Header The report is broken down into J-connectors by row with each row consisting of 16 test points.
|
 Detail Report detail - Pin, Test Point, Nomen, Detail Pin description, which Nodal Ground the test point is on, if its a Nodal ground and the Continuity value entered or measured. In addition, the GXY graphic details including XY coordinates of test point on the GXY graphic and the pin size.
|
Made with help of Dr.Explain
|