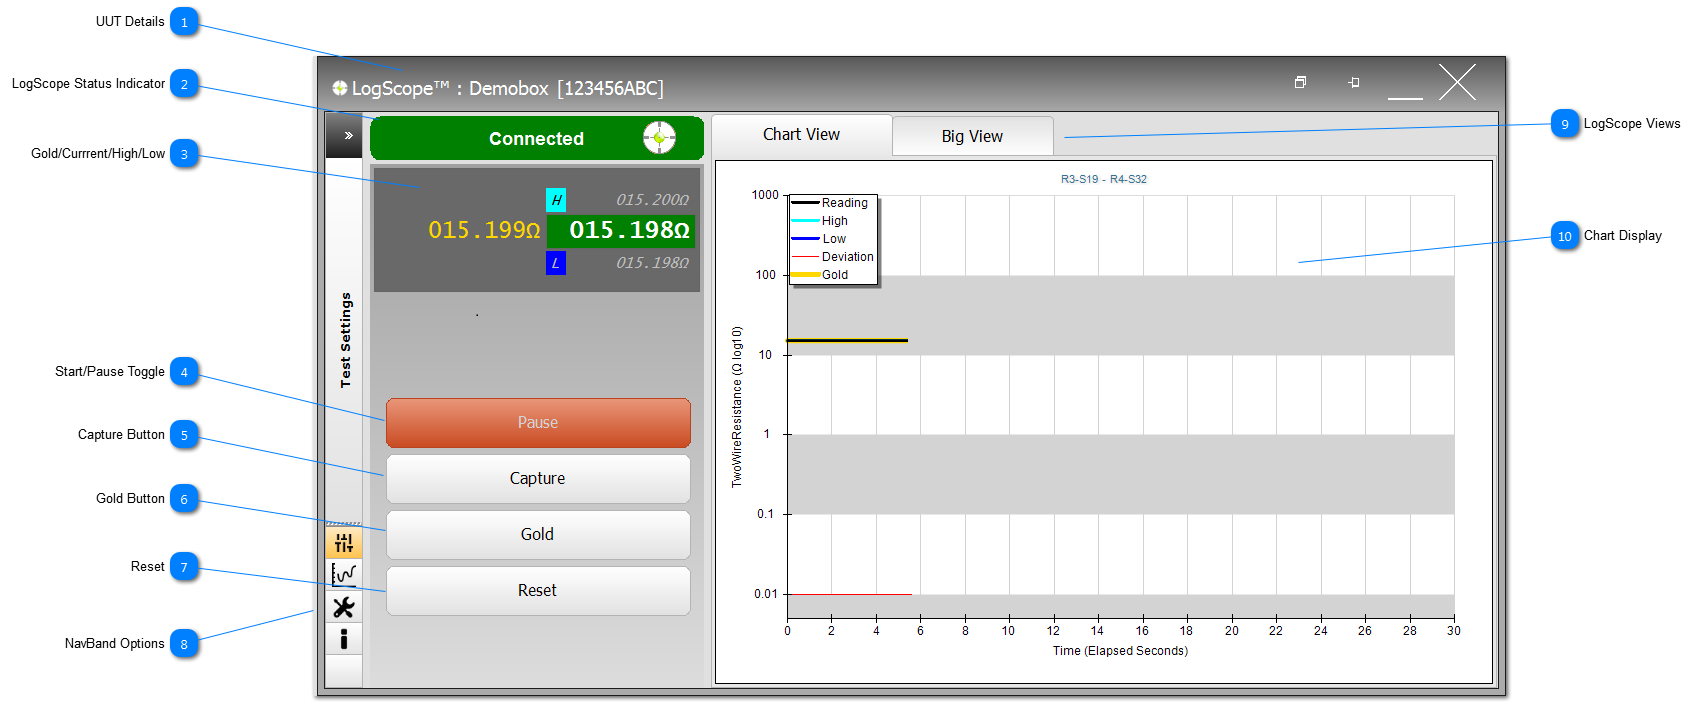
UUT Details Displays the current UUT details and its serial number (shown in square brackets).
|
 LogScope Status Indicator LogScope can be used as a stand-alone application, with the settings being supplied by the logscope.ini file. If LogScope is being used as part of the NODES™ software, then it is setup and controlled by NODES™. Status of LogScope is shown by the status bar which is currently showing that LogScope is connected and the small icon  shows that the application is active. Other states include: Initialising..., Not Connected and Simulated.
|
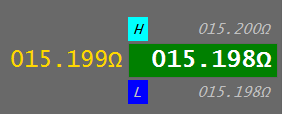
 Gold/Currrent/High/Low The Gold value is shown in yellow; if there is no Gold then '---.--' will be displayed.
The current reading is shown in white on a green background (status is deemed good) or a red background (status has failed).
A failed status will only be shown if there is a Gold, and if the current reading is outside the tolerances set in the Test Profile.
H - Highest value read during the test.
L - Lowest value read during the test.
The current background, the Highest and Lowest readings are all reset when the Reset button is pressed.
|
 Start/Pause Toggle This button toggles from Start to Pause, and allows the User to start and pause the test at anytime.
|
 Capture Button Capture the current results and graphic to a pdf, and the results data to a csv file.
This button will not become active until after approx 5secs of readings.
|
 Gold Button Click Gold to declare the currently readings as the Gold.
If there is no Gold, then the button will show Profile. Use the Profile button to create a new Test Profile using the current test settings, the TPs connected and the current values as the new Gold.
This button will not become active until after approx 5secs of readings.
|
 Reset Clear the current status and set the current readings background to green, set the High and Low values to the next current reading, and clear all data points on the Chart.
|
 NavBand Options The LogScope application has a number of NavBands available to the User (the current view shows the About NavBand selected). See LogScope™ NavBands for more details. |
 LogScope Views LogScope is provided with 2 main views. The Chart View (as shown) and Big View which is designed to provide users an eye-catching view that can be seen from a distance ie across a workshop or on the other side of an environmental chamber. |
 Chart Display The Chart is an endless chart that self-scales based on time. The legend explains the plotted lines, and these lines can be turned on/off in the LogScope™ NavBands.
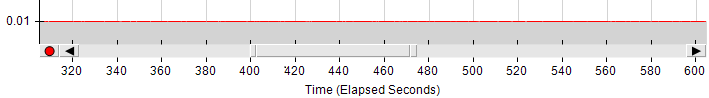
Zooming in/out of the Chart
Users are able to zoom into the Chart by clicking a start point on the chart and dragging zoom-tool to the right to the end point and release. Zoom out by click on a point on the chart and dragging the zoom-tool to the left. Completely zoom out by double-clicking on the Chart or clicking on the red-dot on the x-axis.
Use the arrows or the slider to navigate backward and forwards through the Chart's data points.
|
Made with help of Dr.Explain
|