The traditional Intermittence Testing application is still available to Users on request, and/or is on legacy equipment, but it has since been superseded by the new Intermittence Testing. This traditional application is designed to detects and isolates those components responsible for a temporary, random loss of continuity. The IFD™ TE is optimised to capture and display the resultant intermittent event waveform and converts the information into the UUT associated nomenclature. The User is informed of the event immediately via the screen display, optional synthesised voice and summary reports. The IFD™ TE can be programmed to detect changes as short as a few nanoseconds. By looking for events well below most system failure levels, the test can identify those defective connectivity elements that may pass normal testing parameters yet, under a specific set of environmental conditions, be intermittent when in use.
The results from the test will be displayed in the Results screen within NODES™ once the test has finished.  During the design of the ITA, there may have been a requirement to skip certain test points on a particular J-connector or Virginia Panel. Or alternatively, while the connection may be physically connected within the ITA, the testing scenario may require that a specific test point should be skipped, see Test Point Add/Edit for more details. Both these scenarios still may lead to a skipped/BLANK test point being triggered within the neural network. This is because of the synaptic arrangement of the circuitry within the neural network, and while it does not seem logical, this trigger may be indicating an issue with adjacent and/or associated test points. If a BLANK does trigger, it is advised that the testing regime is widened to help isolate the actual intermittent fault. Also be aware that if a BLANK test point continually triggers, and it is on a regular/time-based pattern, then it could be that the Drive and/or Sensitivity levels are set too high - in which case reduce the levels accordingly and resume testing.
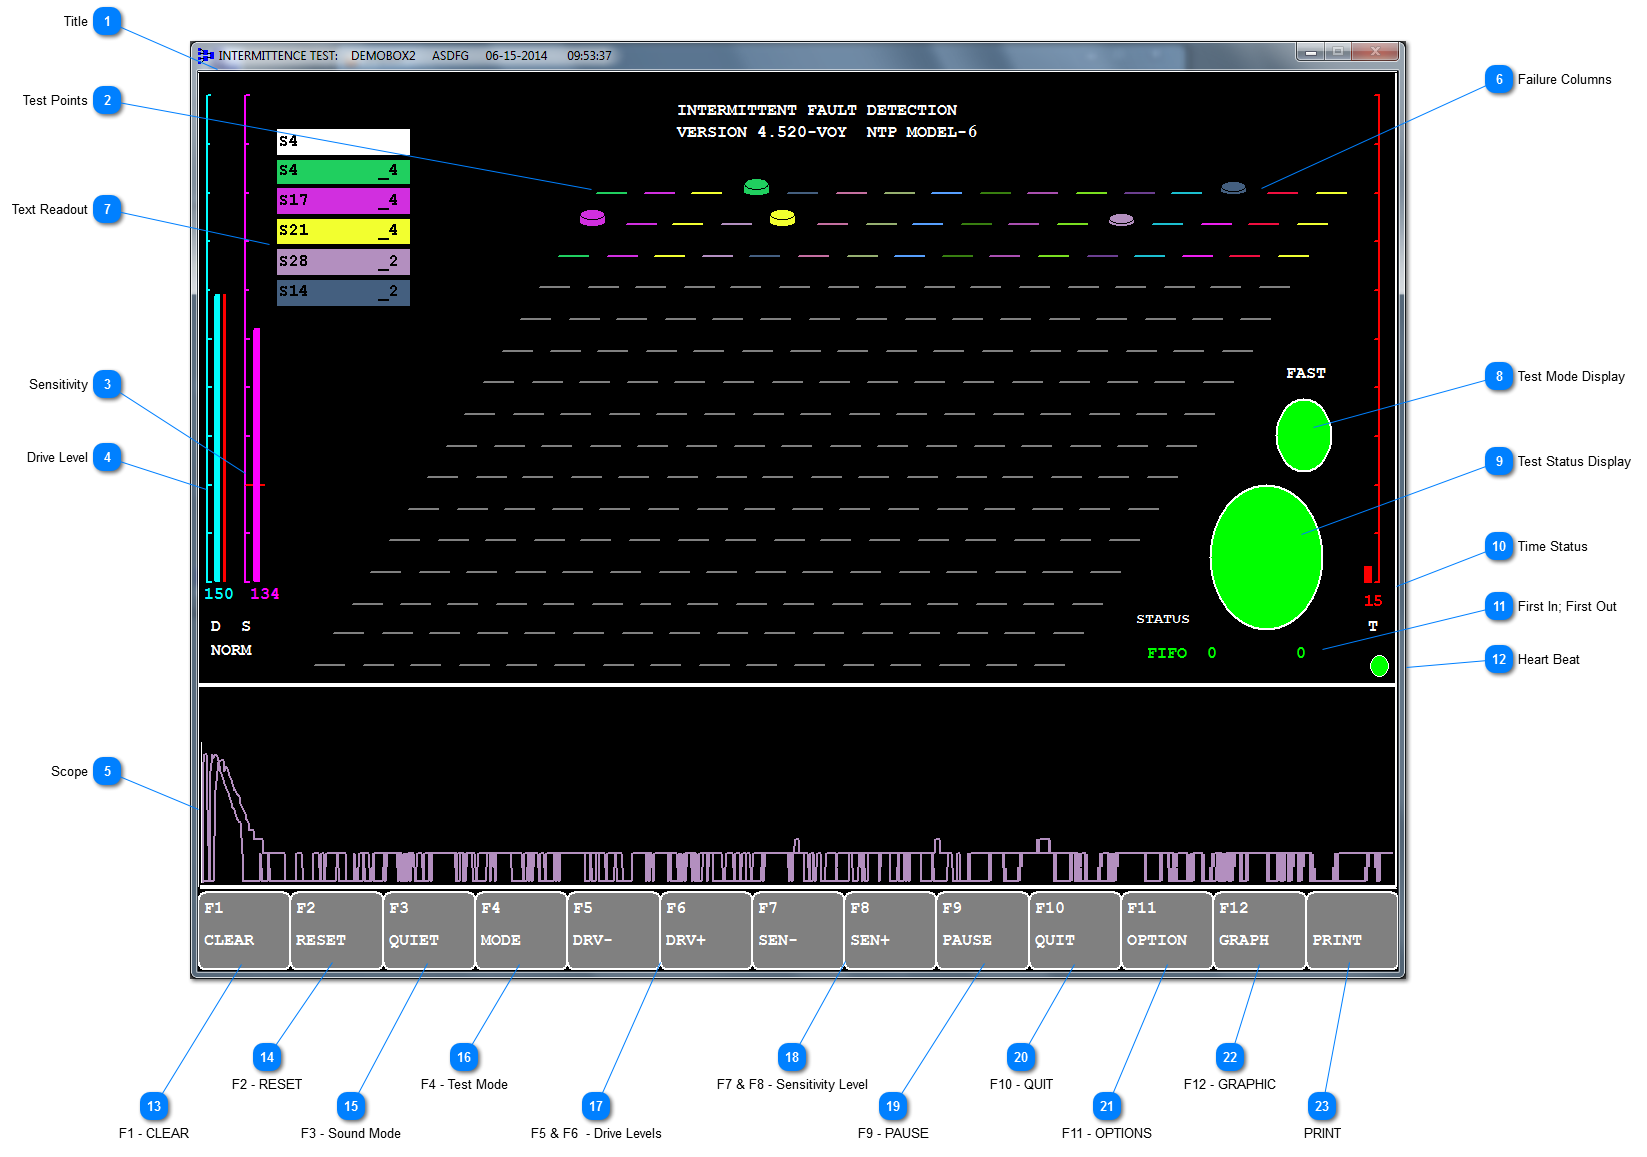
 Title Title shows the test in progress and the UUT name and individual Serial No and time date stamp of the start of the test.
|
 Test Points Each dash on the black screen denotes a test point under test and it corresponds directly to the Test Points entered on the Test Point Add/Edit form. Each line of offset dashes corresponds directly to each of the first 16 rows on the J1-J6 connectors total 16 row x 16 Test Points. Row 1 of J1 depicts TP#1-16 reading left to right, where the bottom right dash is TP#256. |
 Sensitivity The Sensitivity Level (0-255), set in Testing Parameters, is displayed. To change the Sensitivity Level, if in Auto or Manual mode, the User can drag the level up and down on the screen or F7 or F8 accordingly. This parameter cannot be changed in Fixed mode. The ramping of the Sensitivity after a trigger is sometimes critical for certain UUT, and therefore there is an option to set this to Fast/Norm/Slow; the default is Norm. For sensitive circuits this should be test to Slow. |
 Drive Level The Drive Level (0-255), set in Testing Parameters, is displayed. To change the Drive Level, if in Auto or Manual mode, the User can drag the level up and down on the screen or using F5 or F6 accordingly (voltage levels are 0-3.2volts over a 3k W resistor with a maximum of 1.1mA output). The voltage output is sometimes critical to the test and/or the components under test. Therefore, the red adjacent line shows the drive level actually set and read back from the Analyzer; the red line should always be at the same level as the aqua coloured.
|
 Scope This part of the screen is the ‘scope-like’ neural representation of the intermittent event and is essentially the 'signature' of the failure. The signature displayed in the window is the same colour as the failure column shown at the test point positions. The Scope can be cleared by pressing F1. In Fast mode, the scope output is reduced to a tenth of its normal resolution.
The number of graphic points in the scope can be set from zero (off) to 637 points. The more points selected for display might impact on performance. In FAST mode the scope points are limited to a maximum of 150.
|
 Failure Columns As the connections associated with any particular test point experience a connectivity failure, the vertical height of that element grows in a graphical column, providing a clear visual depiction of which test points are experiencing the most intermittent failures. From the example: S14 (TP#14) has had 2 intermittent events detected against it, with the purple part of the column, the cap, corresponding to the text readout at Note 7 opposite. S4 (TP#4) has had 4 intermittent events detected against it.
|
 Text Readout The test point 'call-outs' experiencing the most intermittence are ranked and displayed in the upper left portion of the test screen with the number (count) of intermittent events detected for each. The most recent intermittent detected location is on the top (displayed in white text) and corresponds to the blinking cap of the associated colour bar. The top intermittent test points (if any) are ranked thereafter. The colours of the test point bar caps correspond to the colours in the ranked display.
|
 Test Mode Display Displays the Test Mode as either: AUTO/MAN/FAST
|
 Test Status Display Displays the Test Status:
|
 Time Status The coloured label ‘T’ is a graphical representation of the time left to run as part of the total pre-set test time that will have been set in the Testing Parameters. The test time set is stated in minutes.
|
 First In; First Out In order to capture as many of the intermittent events as possible, the IFD™ testing has been designed to capture the events and then buffer them until there is time to display them. The first figure displays the number of captured events, the second figure is the number of events that have been displayed from the buffered events so far. Once the two figures are equal, then the FIFO is reset to Zero. In reality, the lag from the capture of events to displaying them is a fairly short timespan; this lag only increases if a large number of captured events occur at the same time.
|
 Heart Beat The heart beat monitor will blink throughout the test so long as communications are maintained between the software and the IFD™ TE.
This provides a confidence check to the User that the test is running even if an intermittent event has not been detected.
|
 F1 - CLEAR Clears the graphical intermittent event ‘signature’ in the scope-like window at the bottom of the display. This function does not affect the results captured for later use – the ability to clear the display of the scope is simply for clarity.
|
 F2 - RESET This function resets the whole intermittence test from the start. This will overwrite any results already captured.
|
 F3 - Sound Mode Changes the various sound modes from Beep/Voice/Quiet.
|
 F4 - Test Mode Toggles through the Test Modes:
-
MANUAL - allows the User to set the Drive Level and Sensitivity. It is recommended that the User employs a 'worst-case first' approach.
-
AUTO - ramps up the sensitivity automatically changes during the test. The Sensitivity adjustment is done based on results ie if there are no events detected, the Sensitivity is increased, and if the response it too high, the Sensitivity is decreased.
-
FAST - allows the User to fully optimise the Intermittent test by reducing or halting non-critical operations.
|
 F5 & F6 - Drive Levels Changes the Drive Levels during the test period by using F5 & F6, or dragging the bar on the Drive display or clicking on the grey button area; the Drive Levels cannot be changed if the test Mode is set to FIXED.
|
 F7 & F8 - Sensitivity Level Change the Sensitivity Levels during the test period by using F7 & F8, or dragging the bar on the Sensitivity display or clicking on the grey button area.
|
 F9 - PAUSE Select to pause testing, this button then toggles to show as F9 Resume. If F10 is pressed while the test is paused, then the test will exit.
|
 F10 - QUIT Select once to pause the test, which turns the displayed green disc to yellow. Then either select F9 to resume the test or F10 again to Quit from the test. Pressing Esc or pressing the spacebar twice is the same as pressing F10 once.
|
 F11 - OPTIONS This function is used only for Self-Test Map Names only.
|
 F12 - GRAPHIC Opens the Nodal View (GXY graphic) and annotates that graphic, depending on the intermittent faults detected, at the relevant test point location.
|
 PRINT Use this button to create a screenshot of the Intermittent test screen with a time date stamp. The file will be saved in the \TestPrograms\{datasetName}\{mapName}\Data
If a printer is connected, then a print dialog might appear if communications have been established.
|
Made with help of Dr.Explain
|