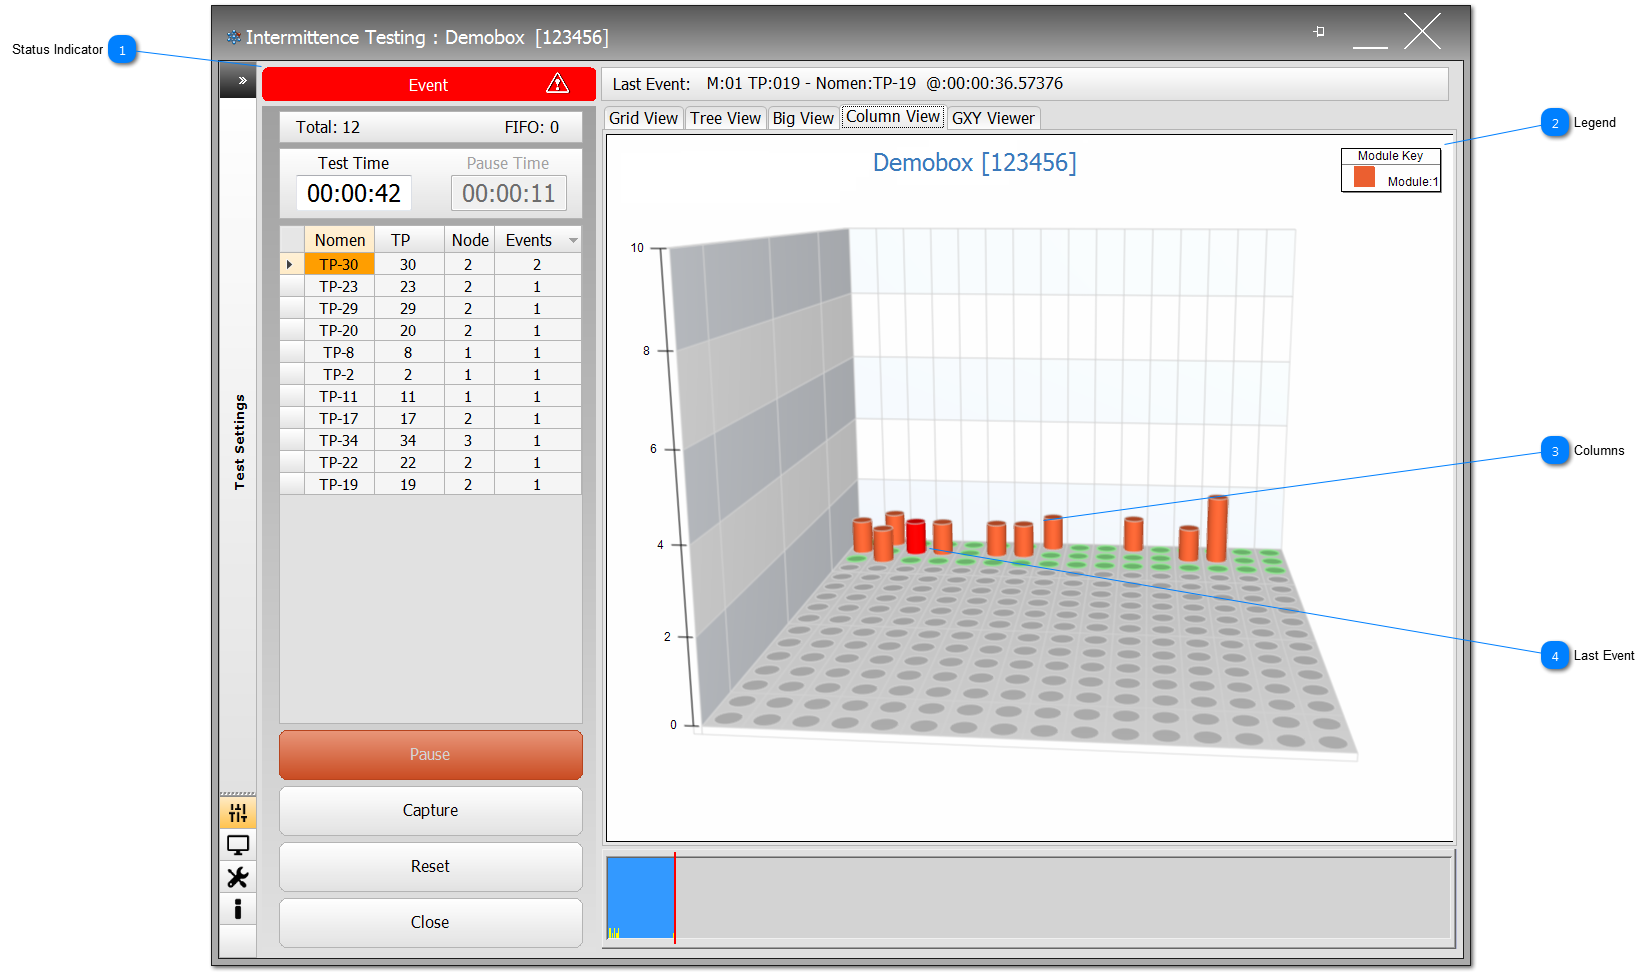
Status Indicator The Status Indicator is a living watchdog, which is constantly monitoring the hardware and ensuring the IFD™ TE is active. If it shows green and Active, Paused, or shown here, or momentarily red and Event, then the User can have confidence that the Intermittent Fault Detection is still running; any other status indication will describe the corresponding error/fault.
|
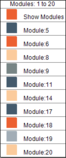
 Legend Legend for the modules configured for Intermittence Testing. Shown here, there is only one module configured. If multiple modules are configured, then the legend would show the module count in the top of the bar, and then, as an Event occurs on each of the modules, the legend will grow to reflect each modules with events. By clicking on the module's legend, then Column View will filter to show the specific module selected. Click on the All Modules colour to reset the applied filter.
|
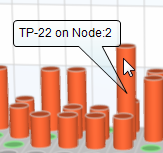
 Columns Each test point on each module under test is represented by a column and a specific colour. The height of the column shows the number of Events that have occurred for that specific test point. Mouse-over the column to show the TP's nomenclature and nodal value.
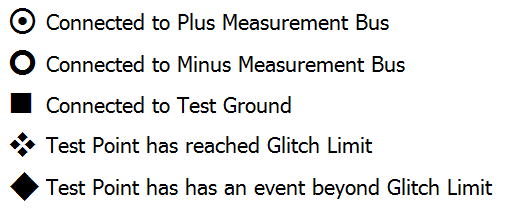
Symbols appear on the columns to show the TP's status; these are as follows:
|
 Last Event The colour of the column changes to Red to signify that it was the last TP to have an Event.
|
Made with help of Dr.Explain
|