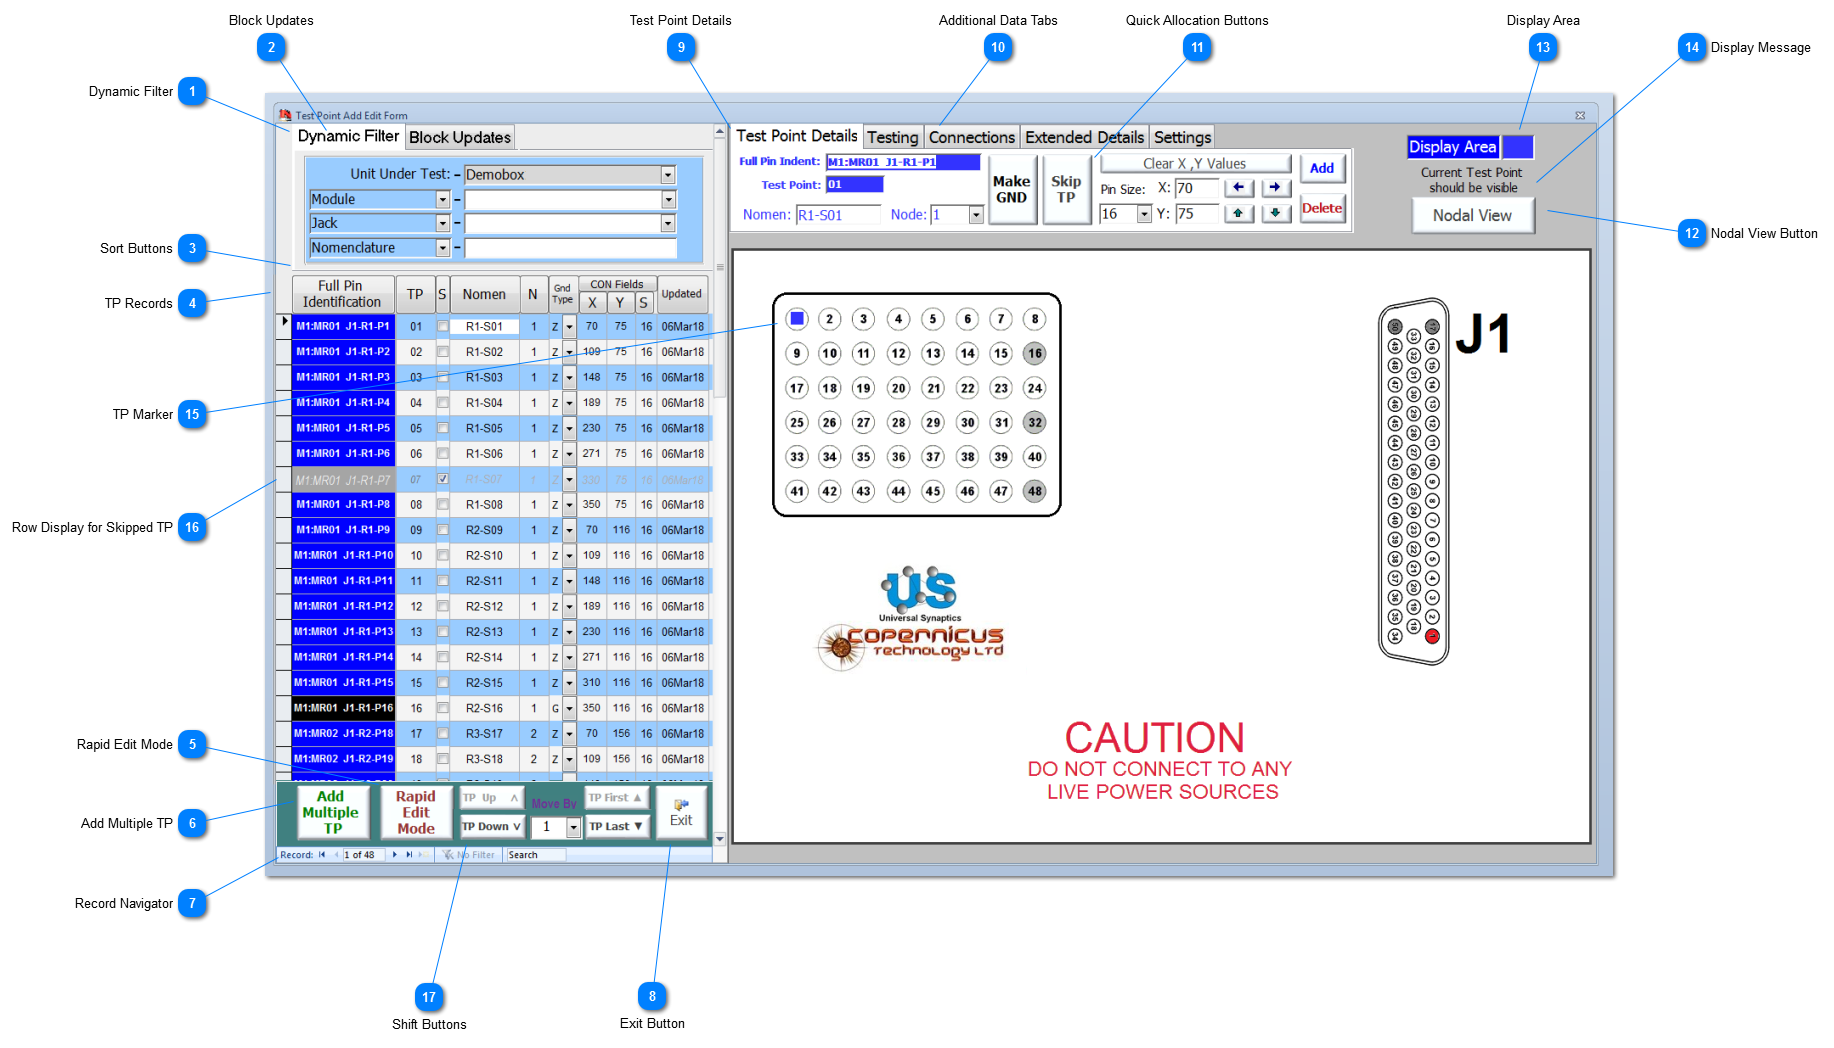
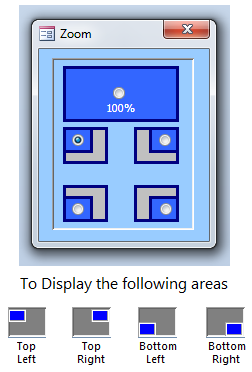
Dynamic Filter Use the various light-blue dropdowns to select the field data to filter, and then use the white dropdowns and free-text field to filter the Test Point data. Only entries that exist in the data set will appear in the white dropdowns. The free-text box can be used with wildcards {*} to filter complex text entries. Double-clicking in any of the white fields will remove that part of the filter.
|
 Block Updates This feature allows the User to update the dynamically filtered Test Points with common value/s as prescribed by the User. See Block Updates for more information. |
 Sort Buttons Each of the columns within the Test Point Summary are headed by a sort button. Clicking on any of these buttons sorts the field in ascending and descending order on each press.
Use the CON Fields button to toggle the fields directly beneath it to display a summary of the Test Profile for CON-Default; the button then show GXY Fields. Press again to display the X, Y, and S fields.
For screen resolutions less than 1280x1024, only the TP, S, Nomen, N and G sort button and associated fields will be shown.
|
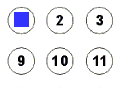
 TP Records The left part of the form summarises the TPs for the selected UUT. The  symbol points to the current TP displayed on the right-hand side of the form. Each TP has a discrete record which holds or references associated data. -
To display the TP in more detail on the right-hand side of the form, click in any part of the row containing a TP record.
|
 Rapid Edit Mode Rapid Edit Mode allows the User to use the summary part of the form (on the left-hand side ) like a spreadsheet, and to edit TPs using the keyboard only. For more information on this mode go to Rapid Edit. This function is not available for screen resolutions less than 1280x1024. |
 Add Multiple TP Click here to display a comprehensive form that allows the User to add multiple test points using similar data and a series link to the test point nomenclature ie if the test points were on a similar connector. See Add Multiple TP for more information. This function is not available for screen resolutions less than 1280x1024. |
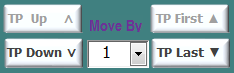
 Record Navigator Use the standard navigation tool to move, filter or search the Test Point recordset. User defined Dynamic filters can be applied to the dataset at the top of the form, any filters added using the Record Navigator or using the shortcut menu (via a right-hand mouse click) will be additional to the Dynamic filters applied.
|
 Exit Button Exit the Test Point Add/Edit form.
|
 Test Point Details |
 Additional Data Tabs NODES™ provides the facility to input additional data for each of the TPs. additional information is not mandatory, and it is not needed for testing, but it can be useful useful when analysing the results between serial numbered items for a UUT or between discrete UUT, ie building up a picture based on most vulnerable connector types; for more information see TP Extended Details. |
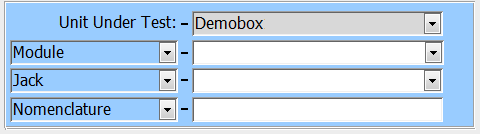
 Quick Allocation Buttons Use these large easy to access buttons to quickly set the Test Point as follows:
-
Left Button toggles between making the Test Point a Nodal Ground or Test Point -
Right Button toggles between skipping the Test Point (ie not used) or using the Test Point
|
 Nodal View Button Click to open the Nodal View of the GXY graphic. The Nodal View will display either the current TP, the TPs related to the current node, or all of the TPs associated with the current UUT. This is defined by the User under the GXY Defaults. If the Nodal View is already open, then this button will display  click to reload and redraw the GXY graphic. The Nodal View is limited to GXY size up to 2100x1500.
|
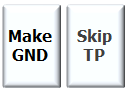
 Display Area The main GXY graphic may have to be scaled to fit the screen size available. When the graphic is scaled, the User has the option to zoom using the right-hand click on the GXY graphic, or the  button on the NODES™ Ribbon. From the Zoom panel select the area of interest. Holding the Shift key and a single right-hand mouse click in the desired quadrant is a shortcut method of zooming into each of the quadrants. |
 Display Message This message shows 1 of 2 messages:
-
Current Test Point should be visible, which indicates current TP is visible in the selected area of the GXY display. -
Current Test Point outside display, which indicates current TP is not visible in the selected area of the GXY display.
|
 TP Marker Each TP can be represented on the GXY graphic as a marker. The markers are coloured Blue for TPs on a node and Black to denote that a TP is a nodal ground. See TP Markers for more information on how they are positioned and moved. TP Types and colours have meaning, see Definitions and Categories of Test Points, but these can't be display in this version of software; new software is due out in Spring 2019 that will fully depicts the TP type and category. |
 Row Display for Skipped TP When a TP is skipped for design and/or testing reasons, the data is kept but the ability to edit the TP details is limited. A skipped TP is shown in the TP Record list in Grey italic text.
|
 Shift Buttons Use the shift buttons to move the current Test Point up and down the TP list. Note that these process does not have an undo capability.
|
Made with help of Dr.Explain
|