×
Menu

Graphical Output of Results

Graphical Output of Results
 
This report is designed to graphically show the results of both Continuity and Intermittency failures on the GXY graphic.
 
1
Report Title
1. Report Title
Basic report title for the report including the UUT description and the Map Name.
2
UUT Graphic
2. UUT Graphic
If a UUT graphic has been allocated, then it will be displayed in the top left of the report, otherwise the Company logo will be displayed.
3
Sub Header
3. Sub Header
The report displays the GXY graphic scaled to landscape A4.  This graphic is then used to overlay the results of Intermittency and Continuity.
4
Results
4. Results
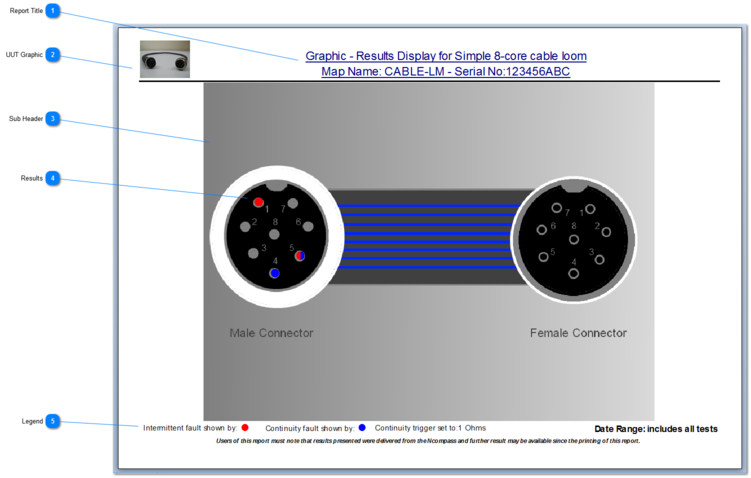
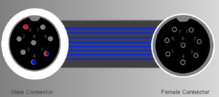
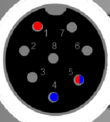
The results for faults for Intermittency (shown in Red) and Continuity (shown in Blue) are over overlaid on the GXY graphic.  If there are Intermittent and Continuity faults for the same test point, then they are shown as semi-circles (as shown at TP 5).  The colour of the circles for each of the faults can be changed by the User on the Report Filter form which is displayed on opening the form.  The chosen colours will depend on the colours used in the GXY graphic.
5
Legend
5. Legend
The legend for the colours that depict each of the faults and the date filter are shown at the bottom of the report.
 
Made with help of Dr.Explain