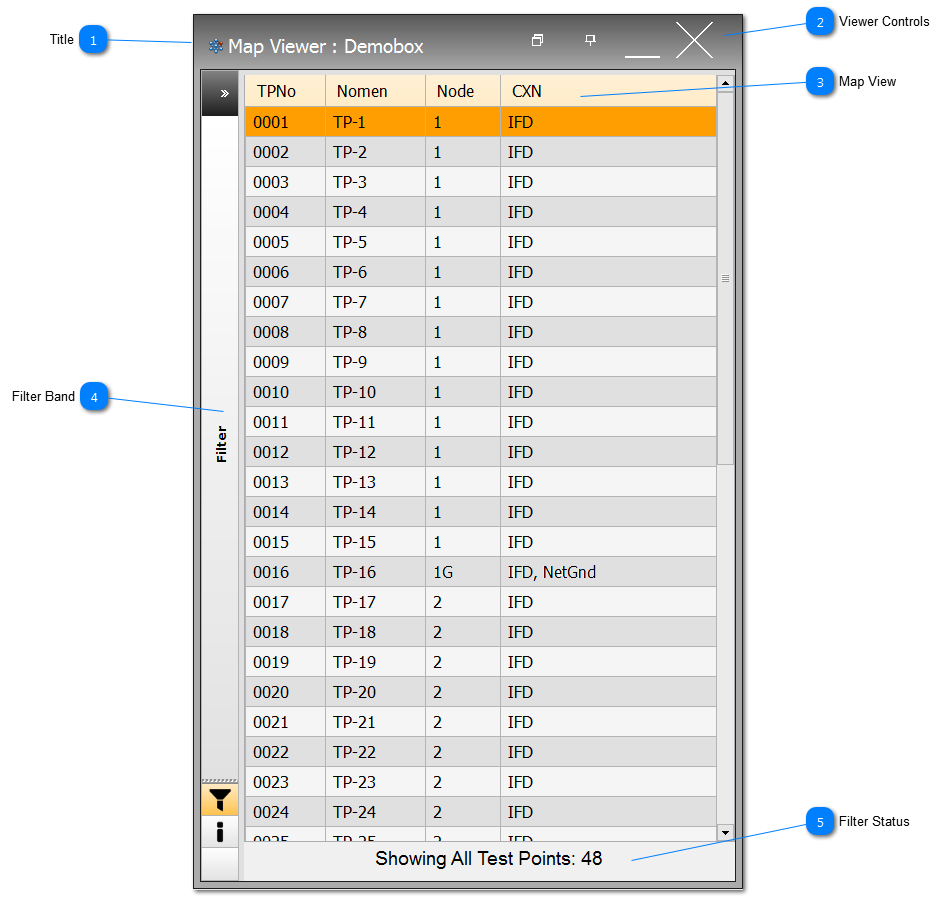
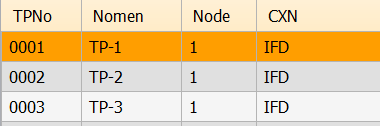
The list shows all the test points in the map, the Test Point number, Nomenclature, its node and CXN is a dynamic view of the current connection status of each of the TPs.
The connections are detailed as follow:
IFD to show that the TP is actively on the IFD bus (Neural Network)
NetGnd to indicate that the TP is suspended or is a Nodal Gnd in the Neural Network
M+ indicates the TP is on the Plus Measurement Bus
M- indicates the TP is on the Minus Measurement Bus
For Click&Test™ extra columns are provided to the right of CXN to allow the User to select TPs, see Map Viewer - Select TP for more details.
The filter status shows the User if a filter has been applied using the Filter Band, and the return test points being displayed as a result of the filter.