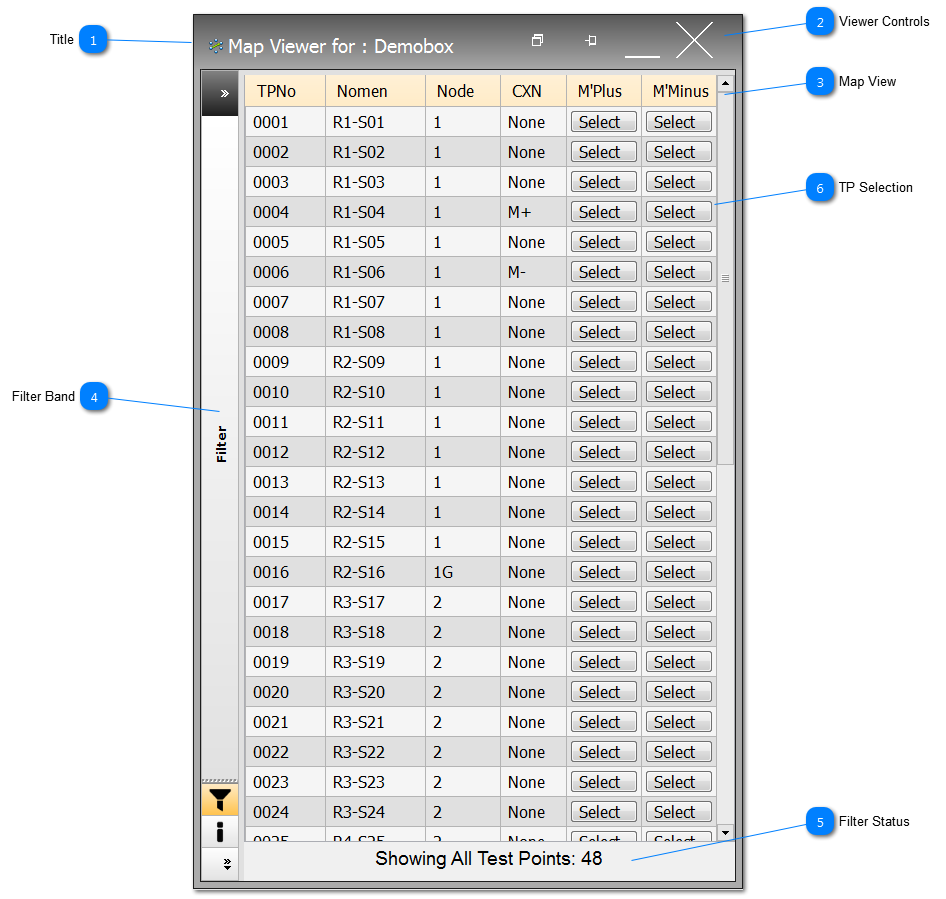
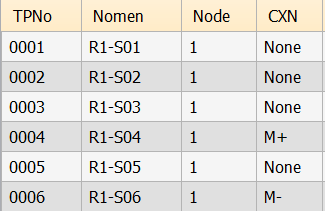
The list shows all the test points in the map, the Test Point number, Nomenclature, its node and CXN is a dynamic view of the current connection status of each of the TPs.
The connections are detailed as follow:
IFD to show that the TP is actively on the IFD bus (Neural Network)
NetGnd to indicate that the TP is suspended or is a Nodal Gnd in the Neural Network
M+ indicates the TP is on the Plus Measurement Bus
M- indicates the TP is on the Minus Measurement Bus
The filter status shows the User if a filter has been applied using the Filter Band, and the return test points being displayed as a result of the filter.
Only one TP per M'Plus and M'Minus measurement buses can be connected at anyone time.
When a TP is selected, the CXN column will indicate if the connection has been made, and show either M+ or M- depending on the measurement bus selected.
If Test Profiles are being used, only the Select column for the master TPs will be shown.