Map Viewer - Select TP
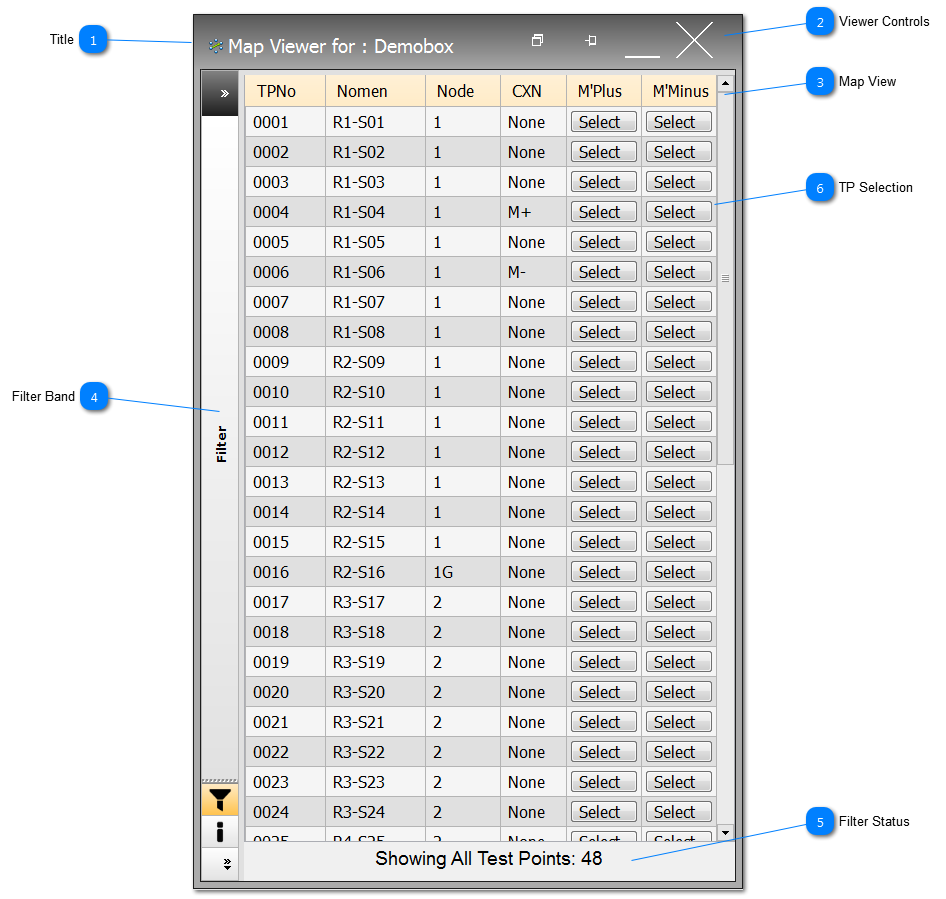
Filter Band Click on the navigation bar to reveal the Filter Band.
|
Filter Status The filter status shows the User if a filter has been applied using the Filter Band, and the return test points being displayed as a result of the filter.
|
TP Selection For Click&Test™ the Map Viewer allows the User to quickly access the UUT Map File in a table format.
From this view, the User can easily select TPs for connection to the nominated Instrumentation ie LogScope™ Testing, Diode Testing, SSTDR Testing, Tracker Testing or External Instrumentation.
Only one TP per M'Plus and M'Minus measurement buses can be connected at anyone time.
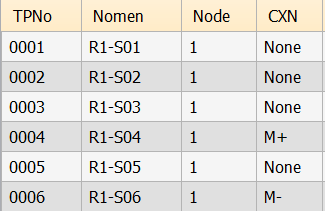
When a TP is selected, the CXN column will indicate if the connection has been made, and show either M+ or M- depending on the measurement bus selected.
If Test Profiles are being used, only the Select column for the master TPs will be shown.
|