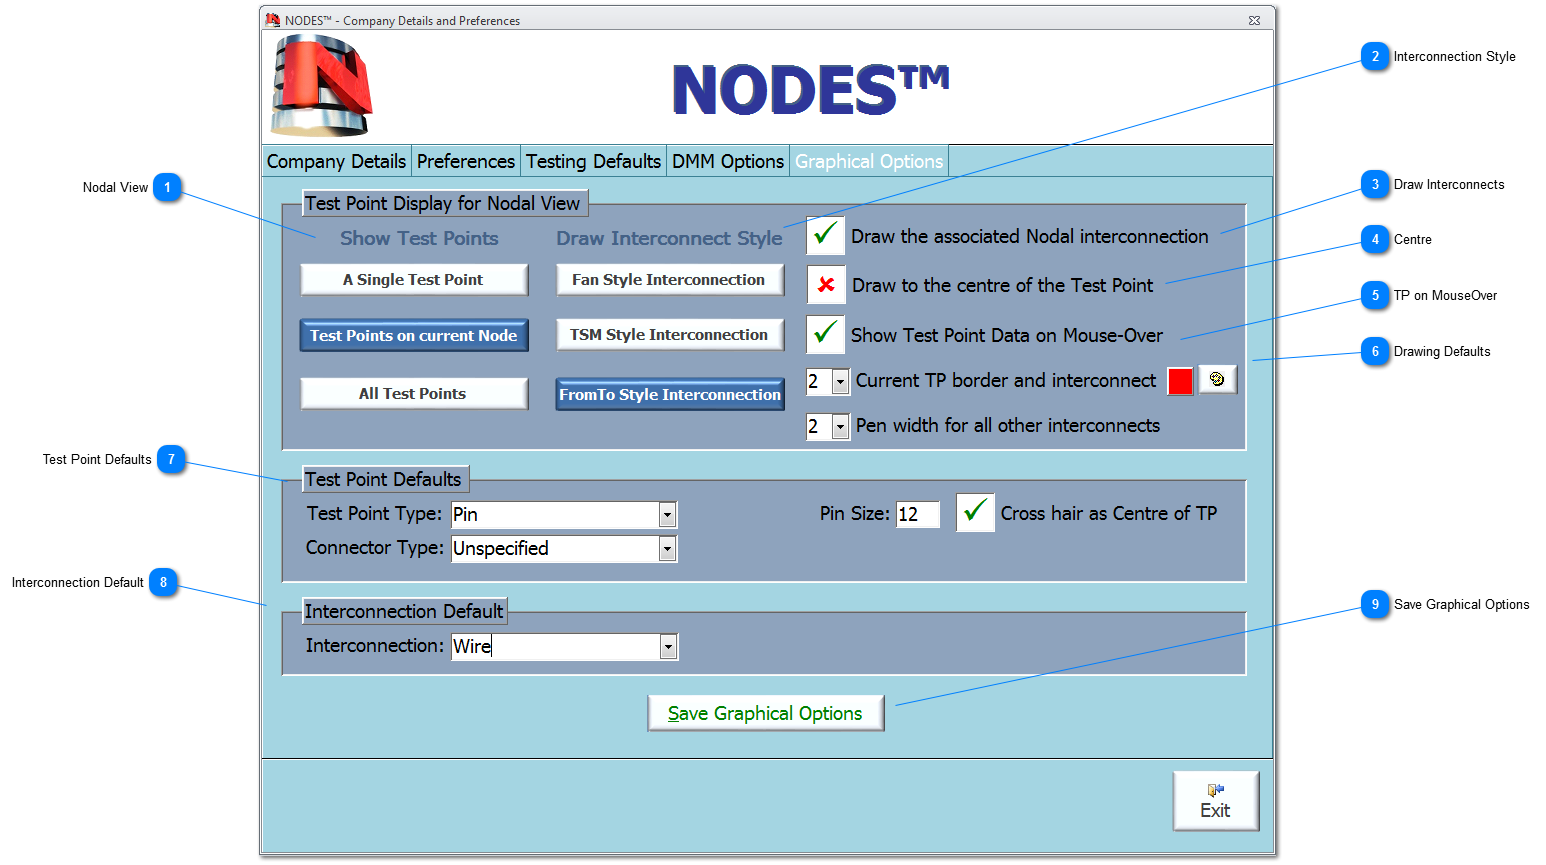
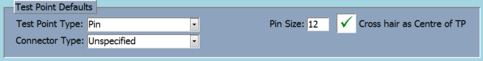
Enter the global defaults for Pin size, colour and shape.
Also enter, when selecting new coordinates or moving TPs on the GXY graphic, whether the mouse pointer is at the centre of the TP or at the top left-hand corner.
Nodal View
A Nodal View, based on the GXY graphic, is made available to the User as a pop-up form showing more information on the TPs associated with the current UUT. This Nodal View can be moved to another screen while the User is editing TPs and it is synchronised with the main TP Add/Edit form at all times.
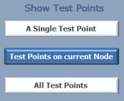
Options for showing TPs on the Nodal View are as follows:
A Single Test Point - this will be the current TP as being added or editted.
Test Points on current Node - this will show all the TPs on the current Node.
All Test Points - this will show all the Test Points in the UUT including Blanks.
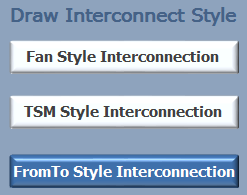
There are various methods of drawing the interconnections between TPs. These are as follows:
Fan Style - draws from the TP to its designated Nodal Ground. This is quick and simple, but is not representative of how a UUT might be wired.
TSM Style - draws from TP to TP in the shortest distance to show a neat drawing of the TP interconnection. This is a long process and is not representative of how a UUT might be wired.
FromTo - draws from TP to TP based on the data entered in the TP Connections during import and/or Add/Edit Test Points. This is know data of how a UUT is wired, and so provides an accurate schematic of the UUT.
Switch on/off the drawing of the interconnection between TPs. This might be used to switch off interconnects on a complex UUT for clarity. Default is Checked.
The User can specify the defaults for drawing the current TP on the Nodal View. The width of the pen (which is effectively the border of the TP marker) and its colour can be set using the dropdown and the palette icon. The pen width for all the other interconnects, if shown, can also be set.
If changes are made to the details held in this view, then the Save Graphical Options button will turn red; thus prompting the User to save the new information.