LogScope™ Testing
LogScope™ allows the User to graphically track small resistance changes measured across any two test points in the UUT to aid in diagnosing which points within a node may be causing continuity issues, a shorting condition, or circuit intermittency. This secondary testing would typically be carried out if a test point has exhibited intermittent faults and/or is showing as a potential issue in other tests functions.
For instance, when continuity testing shows that there is a high resistance between two TPs, it is not known which of the two TPs is really the cause of the problem. Using LogScope the User can measure between any two connected points, and then monitor the connectivity between these points as the TPs are stimulated, ie wiggled, tapped or otherwise stress the mating surfaces of the UUT. This methodology will help to isolate the problem at its root cause.
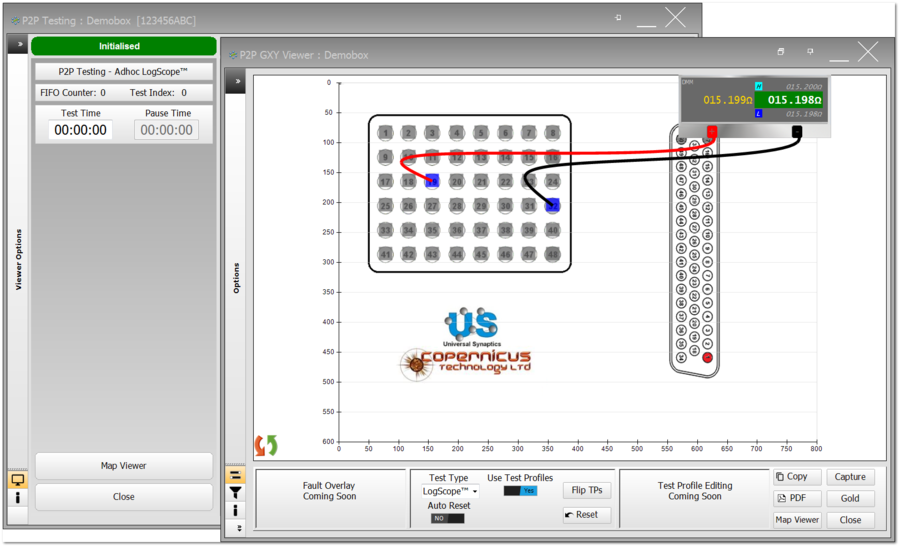
The LogScope function, within the IFD™ test environment, captures and then plots each measurement and the difference between the current and the previous measurement as logarithmic values on the screen. The screen above show how the TPs can be selected using the Click&Test™ methodology, and when connected, shows the Secondary Display. By clicking on the Secondary Display, the LogScope™ Application will come to the front.
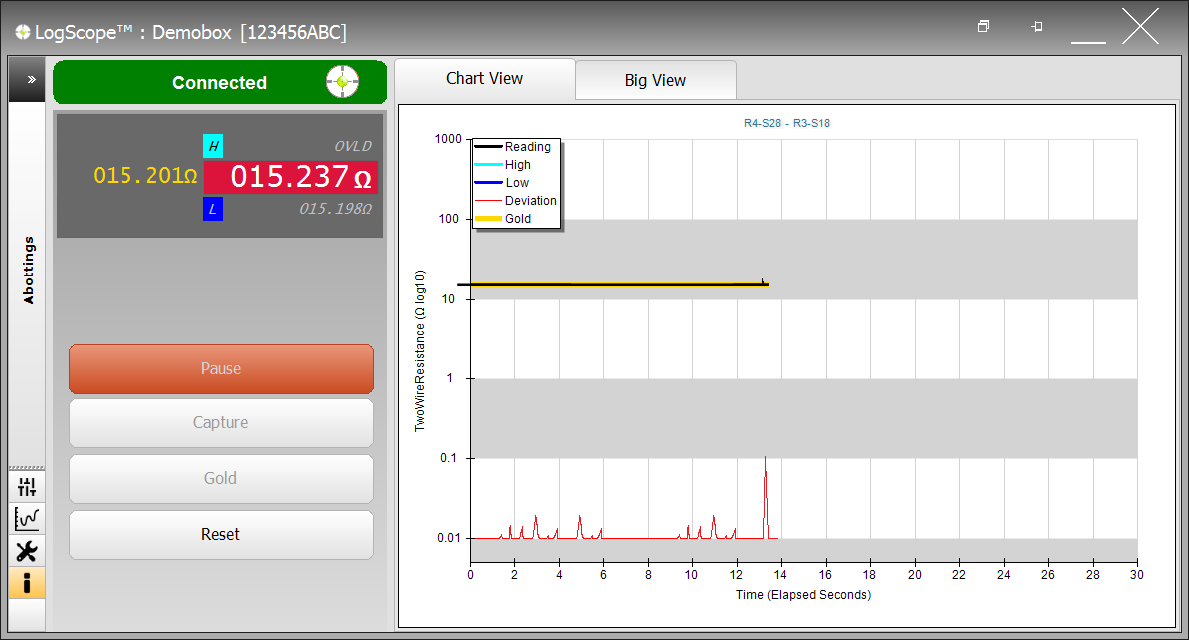
The example above illustrates the LogScope™ Application and a test being carried out on TPs: R4-S28 to R3-S18. The test shows a Gold value of 15.201W (shown in yellow) and the nominate value of approx 15W being measured and plotted in black in Log10. The trace in red shows the absolute difference between the previous and current readings to the Log10; for a 'good/stable' test, the red line should be as close to zero as possible, and it would not have any spikes or plotted points above the baseline datum. Any deviation from the datum reading, positive or negative, is shown by the red spike line (see the spike at approx 13secs), and thus shows that the connection between the TPs under test are unstable. The current reading of 15.237W on the red background shows that the test has at one point exceeded the tolerances set in the Test Profile being used; the background will always remain red, even if the current reading is within tolerance; this is to show the user that a fault condition has occurred at some point in the test. This can only be reset by using the Reset button on the LogScope™ Application.