×
Menu

GXY Viewer

GXY Viewer
1
Title
1. Title
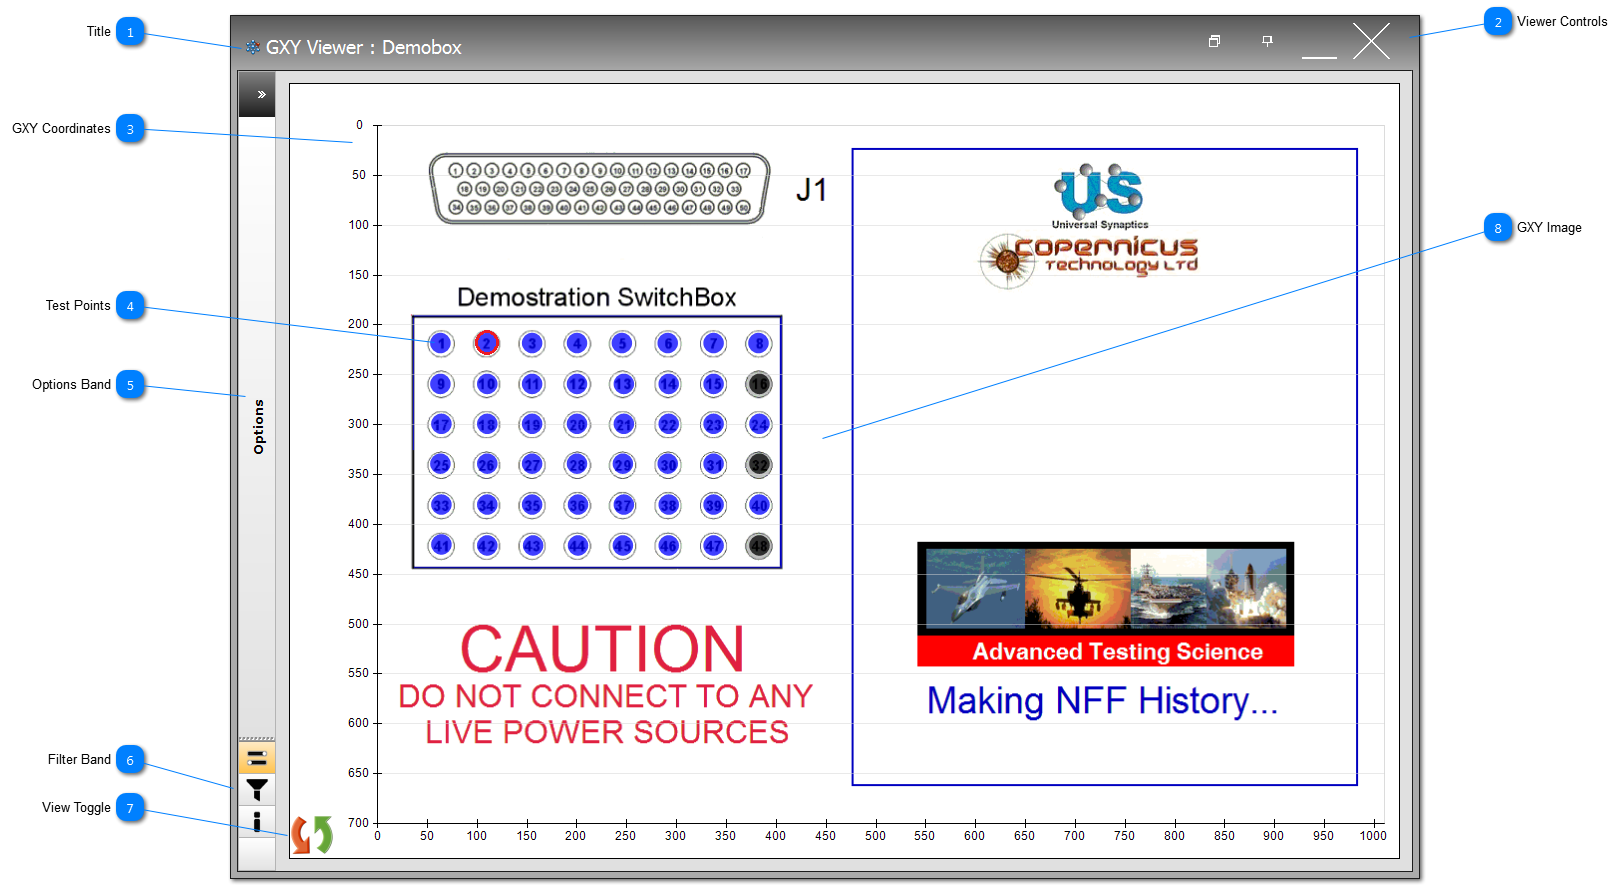
Title shows the viewer type and the UUT's name.  Addition information is shown if the GXY Viewer is opened by a specific test point; the GXY Viewer will be pre-filtered by the node of the specific test point that opened it, and this will be shown in the title.
2
Viewer Controls
2. Viewer Controls
Viewer Controls include (from the left), 50% Opacity, Pin Viewer to the Top, Minimise and Close.
3
GXY Coordinates
3. GXY Coordinates
The X & Y axis show the coordinates of the GXY graphic.  The upper top left is 0,0 and it should be noted that all test points mapped onto the GXY use this as their datum.
4Test Points
4. Test Points
All TPs that have been mapped onto the GXY using the Test Point Add/Edit will be shown on the GXY.
The TPs can be represented as various shapes, sizes and colours; see Definitions and Categories of Test Points.
TPs can be clicked to provide different interactions included, popup forms to control TP testing or to get additional test point information.
If the TP is bound by a red line this indicates it was the last TP to have an Event (Intermittence Testing) or Fault (P2P Testing).
 
5
Options Band
5. Options Band
The GXY Viewer has a number of display options provided by the Options Band.
6
Filter Band
6. Filter Band
Filter the test points displayed using the Filter Band.
7
View Toggle
7. View Toggle
Some GXY graphics are quite complex and as a result it can be difficult to see the test point markers.  This toggle can be used to make the GXY graphic invisible and just leave the test points in view.
8
GXY Image
8. GXY Image
The GXY graphic is used to navigate the UUT's map, and represent the UUT's map in a more user-friendly environment.  See UUT Graphics for more information.
Made with help of Dr.Explain