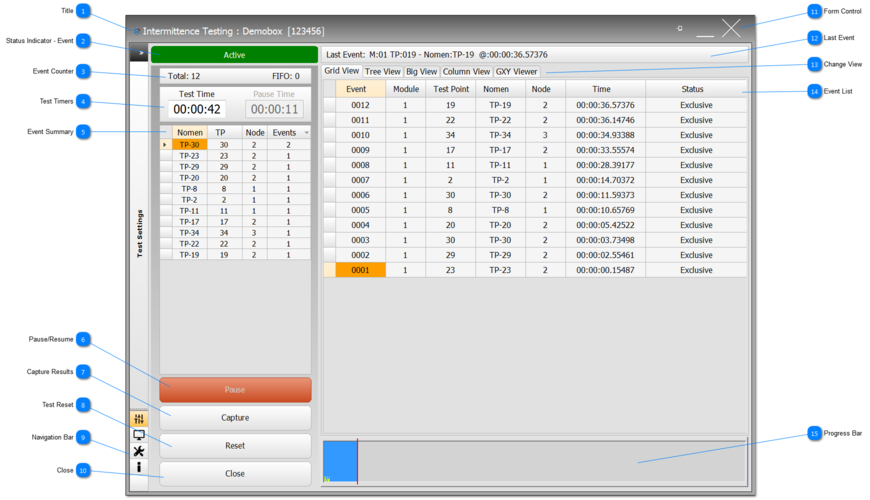
Title Title shows the application name, followed by the UUT Test name and the serial number of the UUT in square brackets.
|
 Status Indicator - Event Shows the status of the test and includes: Active (shown here in Green), Event trigger (Red), Test Ended (Black), Simulate (Orange). The Status Indicator is designed to be large enough to be seen at a distance and catch the user's eye should an event occur.
|
 Event Counter The Total shows the total number of events detected, isolated and validated; if events are logged after a TP has reached its Glitch Limit, then the Total output format is shown Total: 12 (GLimit:3)
The FIFO Counter shows the accumulation of multiple events being stored ready for processing and then presenting on the GUI output/s of the application; in normal conditions it is rare to see this counter rise above zero. There is an Option to set a FIFO limit, see Options Band. |
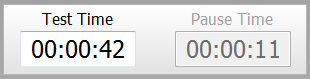
 Test Timers Test Time shows the actual time in hh:mm:ss format that the test has run. Any time the test is Paused, the Pause Time is recorded in a similar format.
The actions of either Pause, Reset, Resume are recorded in the Log File.
|
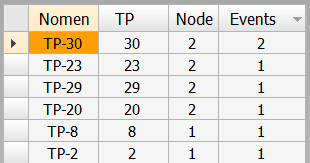
 Event Summary The Summary collates the events for each test point and then orders them in frequency of occurrence, with the most frequent placed at the top of the Summary list.
|
 Pause/Resume Use this button to Pause the test, and once paused, the button changes to Resume. For self-test, this button also becomes the Start self-testing button.
Shown in the toggled state of testing, and if pressed, will pause the test and will show Resume; to re-start the test, press the button again.
|
 Capture Results Use this button to capture the current results to PDF. The capture includes the Summary View and the current View combined on a single PDF page. Each click of the button adds a new page to the PDF document.
|
 Test Reset Click to Reset the test with the default settings and the configuration of the Map File. There is no warning when using this function.
An reset of the test is recorded in the Log File.
|
 Navigation Bar The Navigation Bar allows the User to access the following navigational bands:
 Application Information Application Information |
 Close Close the application. If testing has not been completed, the User will be asked if they wish to continue.
|
 Form Control Minimise and close the application using these controls.
|
 Last Event Displays the last Event detected and isolated by the IFD™ TE. Shows the Module number, the Test Point number and its nomenclature, and the exact time it occured with reference to the start time.
|
 Change View |
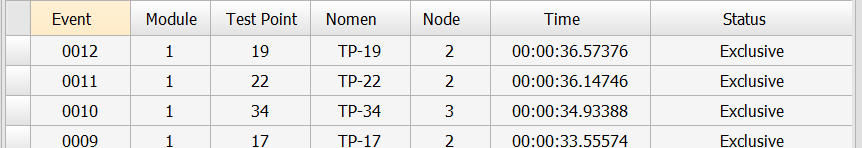
 Event List A list of Events detected and isolated by the IFD™ TE in reverse order (unless sorted by the User). Headings reflect the details of the TP with the Status. The Status will read either Exclusive or Multiple. If it reads Multiple, then it is possible that a nodal ground in the testing circuit has become intermittent and this will trigger events on the same nodal circuit.
Depending on mode, the QIndex will be displayed in the Status column; QIndex is a 0-1 based index that represents how quickly the Neural Network takes to go quiet; the lower the number the faster the circuit has gone quiet after an event.
|
 Progress Bar The Progress Bar is scaled on the test running time. The blue portion shows the time the test has run, and the grey shows the time left to run. Click and hold in either the blue or grey areas and a popup with the precise timings will appear. The yellow vertical bars show Event activity in relation to the test run time; the higher the yellow bars, the more Events that have been detected and isolated at that particular test time.
|
Made with help of Dr.Explain
|