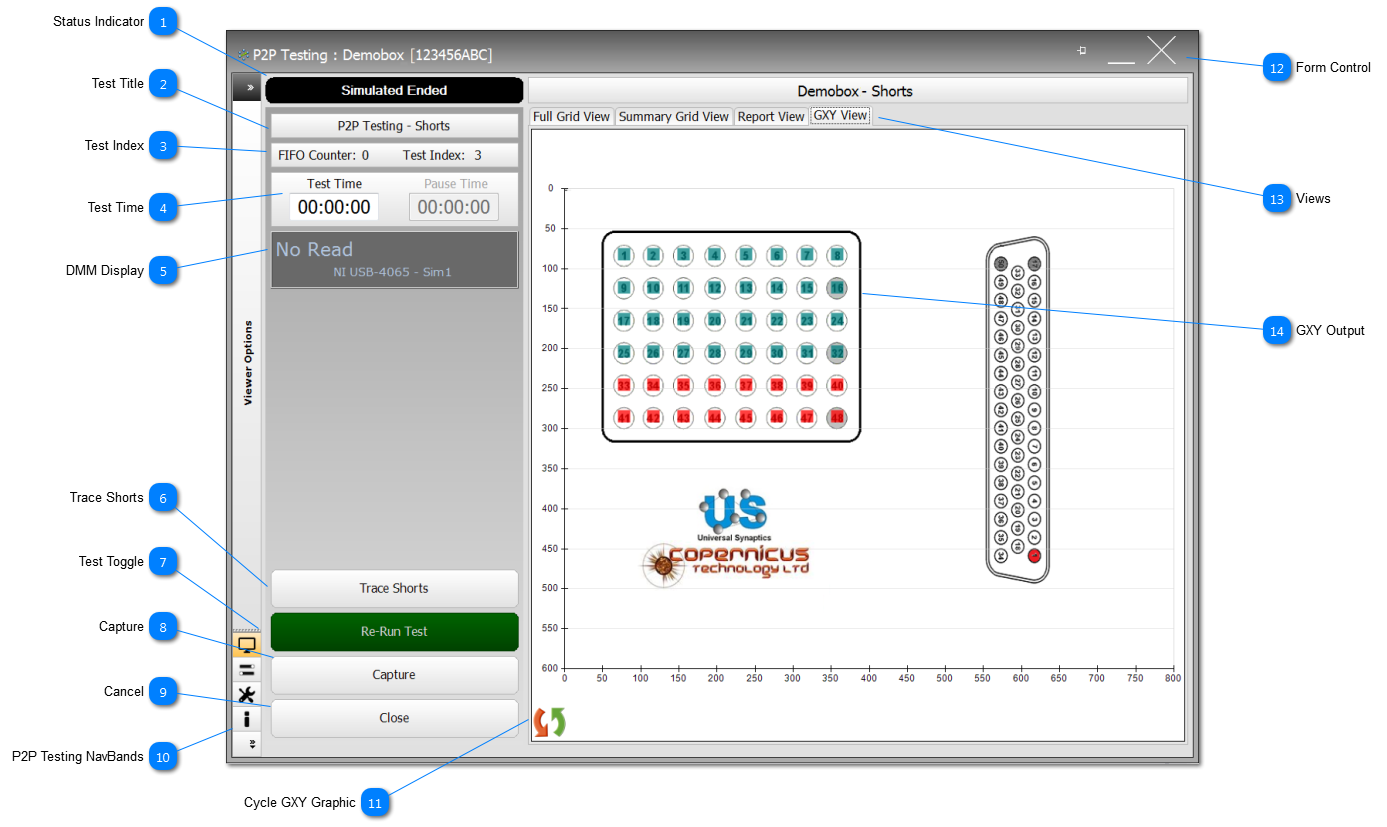
Shows the status of the test and includes: Active (Green), Fault (Red), Test Ended (shown here in Black), Simulate (Orange). The Status Indicator is designed to be large enough to be seen at a distance and catch the user's eye should a Fault occur.
Shows the application name and the test mode the application has been configured for. In this example, this is the P2P Testing application which has been configured for Shorts.
The Test Index is the count of tests that have been completed. A single test may comprise of multiple connections and readings.
The FIFO Counter displays how many test results are held in the test application's FIFO awaiting processing. The FIFO Counter can start to rise if the CC's CPU becomes busy with other activities; normal the counter will hover around 0 to 1.
Panel displays the actual Test Time for the test to complete. The Pause Time, is the actual time the test was paused for by the User. The total Test Time does not include the Pause Time.
The DMM Display panel show the status of the DMM, this will include the Model and Serial No if the DMM is connected, and the phase 'Not Connected', if it has been disconnected.
For Continuity testing, the DMM Display is set to off, because the readings are being taken so quickly, it would be meaningless to try and display them.
However, if the test is Paused, then the DMM Display is set to on, and will show current readings.
When the test has ended, the DMM readings are suspended and will show 'No Read'.
Once the Shorts test has completed, and if shorts have been found, then the Trace Shorts button is made visible. See Trace Testing for how to use this test.
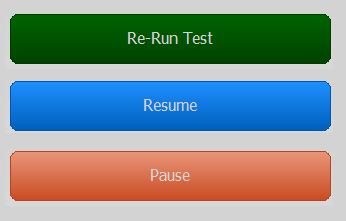
The Continuity test is running in the example shown, and so the Test Toggle buttons is showing Pause.
On pausing the test, the button will show Resume. The User can connect or disconnect TPs from the various measurement buses, and perform ad-hoc test mid-test.
Once finished, press the Test Toggle button marked Resume, to continue the test.
When the test has ended (shown by the Status Indicator turning Black), the Test Toggle, will show Re-Run Test
The Capture function allows the User, as anytime in the test, including start or end, to Capture the GXY View and the results in the Grid View. The Captured snapshot, is compiled and creates or adds to a pdf in the \TestPrograms\datasetName\uutname\Data with a file name that reflects the UUT, the test and the date eg CABLE-LM[Shorts](2018-07-20).pdf
At anytime during the test, this button will show Cancel. On completion of the test, it will show Close. When showing Close, pressing this button is the same a clicking on the form's cross in the top-right.
Click on the cycle logo to remove the GXY image and just leave displayed the GXY objects (TPs and Lines). Click on the cycle logo again to restore the GXY image.
The form control includes (from the left), Pin to Top, Minimise and Close. If Close is selected during a test, the User will be asked if they would like to continue.
Different views are provides for the User to display in various formats the test results.
Full Grid View - all test results shown in reverse chronological order.
Summary Grid View - same as Full Grid View but with only the faults listed.
Report View - a compiled test report which is completed once the test has finished (shown here disabled because the test is in progress).
GXY View - a view of the GXY graphic
For this example, the GXY shown here is embedded in the application because the GXY is small; for larger GXY, this will be disabled and the GXY Viewer will need to be opened under the NavBand Viewer Options.
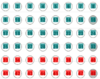
At the beginning of the test, all the TPs are shown as 'Dim Grey'. As the test progresses, the test points within the node tested are coloured in with a jade colour if no short was found, and red, if a short was found. As shown in this example, the top 4 rows (which is Node1 and Node2) have no faults, but the last two rows (Node3) has a short somewhere in the UUT.
By clicking on the TP objects a Popup will appear, that will provide additional information and control for the specific TP selected.