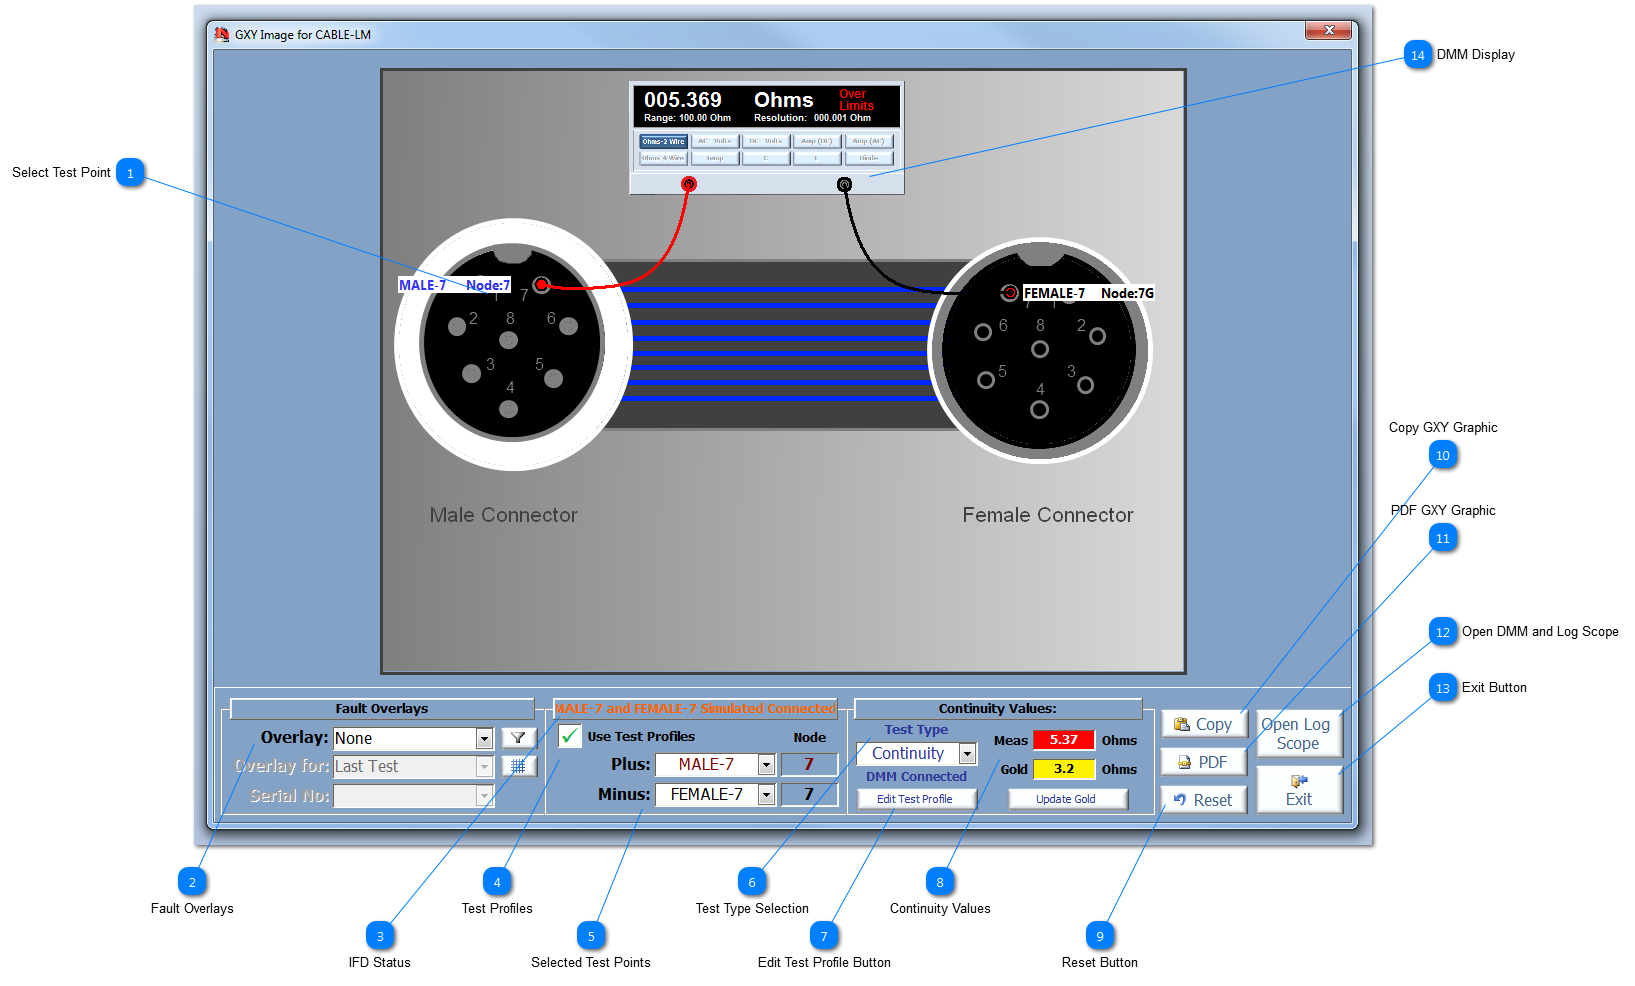
Use the mouse to move over the TPs on the GXY graphic. As a TP is found, a popup display will appear on the GXY graphic to show the data associated with that specific TP - Nomen & Node. The text in the popup is written in blue for TPs and black for Nodal Ground TPs.
The solid red dot shows that that specific TP has been selected to connect to the positive side of the DMM.
The solid red dot with a black dot in the centre shows that that specific TP has been selected to connect to the negative side of the DMM.
If a TP is selected, then NODES™ will automatically connect this TP to the positive side of the DMM, and the TP's associated Nodal Ground to the negative side of the DMM. If a Nodal Ground is selected first, and there are multiple TPs associated with that Nodal Ground, then each possible associated pair will be highlighted for the User to then select the relevant TP. If there is simply one TP for the selected Nodal Ground, then this will be automatically selected and connected to the positive side of the DMM.
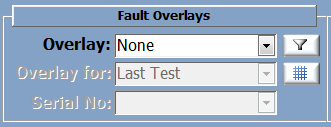
Fault Overlays allows the User to display on the GXY graphic faults that have been detected during testing. The faults can be overlaid onto the GXY graphic by test type and/or a combination of test types; as the selections are made using the 3 dropdowns, the text turns red - click on to apply the selected filter. The faults can be filtered by applying the following:
Overlay: None, All, Intermittent, Continuity, Shorts, Continuity And Shorts, Log Scope
Overlay for: Last Test, Tests done in last hr, Tests done in last day, All Tests
Serial No: as required
The faults are overlaid on the GXY graphic as coloured circles for the various test types and they are also encircled by a red ring to show they are faults. If 'All' faults have been selected to be overlaid, then the faults are drawn in the following sequence: Continuity, Shorts, Log Scope and then Intermittent - for example if there was a fault for each of the tests listed, Intermittent fault will be shown.
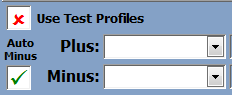
Each TP can have a number of Test Profiles and as a default at least 1 Continuity Test Profile. To use the Test Profiles check the Use Test Profiles option. When a TP is selected it will automatically select the other TP associated with the Test Profile; if there are multiple Test Profiles, then the User will be requested to select the desired Test Profile.
However, if the User does not wish to use the Test Profiles, this option can be uncheck to allow adhoc selection of TPs. For example a TP might need to be checked against an unassociated TP not on the same Node. If this specific configuration needs to be formalised, then a Test Profile can be created.
Unchecking the Auto Minus allows the User to be free to select any TPs for the Plus or the Minus side of the selected Instrumentation (in the case shown above the DMM).
Test Points can be selected using the mouse on the GXY graphic or using the dropdown fields. Any combination of TPs can be selected for spot-continuity testing, Log Scope, SSTDR, Tracker etc, even if they are not related on their associated node; for example this function might be used to check for a short between different TPs on a adjacent nodes. If the Auto Minus check box has been checked, then NODES™ will automatically set the Nodal Ground for a specific TP selection; this is for both mouse and dropdown operations.
The first TP selected is assigned to the positive side of the DMM, and if the first TP is not a Nodal Ground, then the second TP is automatically assigned as the first TP's nodal ground; both TP can be changed using dropdown menus on the GXY graphic. If a DMM is connected, then a resistance reading will be performed between the test points as a confidence that the selected TPs have been switched and are connected to the DMM.
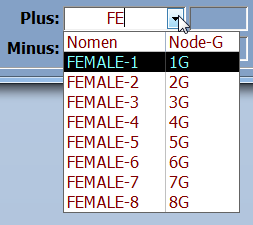
To filter the dropdown, enter a value in the dropdown field and the field will automatically filter to that value. In the example below, the letters FE have been entered.
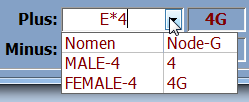
Use the * as a wildcard can be quite useful for example enter E*4 will return the following:
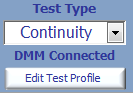
While this form will open with the relevant Test Type already selected, there is option to change the Test Type. A list of Test Types will be displayed in the dropdown field based on the instrumentation available.
Options that may be made available are:
Continuity - uses the DMM in 2-Wire Ohms mode (shown here as the default)
Diode - uses the DMM in Volt Diode for all Diode Testing
SSTDR - now only available on Click&Test™ and uses the LiveWire SSTDR in Dynamic Mode for SSTDR Testing
Tracker - now only available on Click&Test™ and uses the Huntron Tracker for all Tracker Testing
If the selected TPs have an associated Test Profile, then there is an ability to edit that Test Profile, in this case edit Test Profile - Continuity.
If there isn't a Test Profile, then a default profile is applied based on the values entered in the Testing Parameters form, and the Create Test Profile button will appear. If the User then wishes to create a Test Profile, then selecting the Create Test Profile button will populate the Test Profile with the defaults, and present the User with the ability to edit the profile.
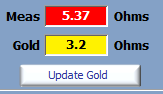
Once the selected TPs are connected within the Analyzer, and if there is a DMM available and connected, then a spot-continuity reading is taken and it is displayed as Meas. This reading is then compared to the Gold value, if this has been set in the Test Profile. If the Meas reading is within the tolerance set when compared to the Gold, then the field will be coloured green, otherwise it will be coloured amber if it is within 50% of the tolerance set or it will be coloured red.
Other displays are:
OVLD - reading is over range for the DMM.
No Read - means that no DMM is available or the Analyzer cannot be connected.
Copy the display of the GXY graphic with the associated instrumentation, measurement readings and graphically drawn connections to the TPs on to the clipboard. This can then be pasted into programs such as Paint or a report writing documents such as Word.
The current display is made into a PDF and saved in the \TestPrograms\{Dataset Name}\{UUT Name} directory. Each press of the button adds a new page to the PDF document; if the PDF document is open by another program, then a new PDF will be created with the addition of the date and time as part of the file name.
The GXY graphic is Date Time stamped in the bottom right-hand corner for reference.
Click to open the DMM and display the current reading for the connected TPs; this function is not available if the Analyzer has not successfully connected to the selected TPs or the DMM is not available. If Log Scope has been selected as an option in the Test Options in the Test Parameters form, then the LogScope function will also be displayed.
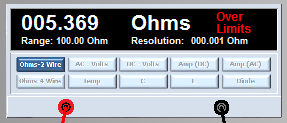
Once all the connections are made and checked, a continuity reading is taken. If a valid reading is taken, then a DMM graphic is drawn on the GXY graphic which will reflect the value of the reading, the Range and Resolution of the DMM and if the value was Within Limits or Just Over Limits or Over Limits; this depends on the tolerances set on the Test Point Default Test Profile.
The DMM refreshes every 250mSec, takes a new reading, calculates the tolerances and updates the GUI accordingly.